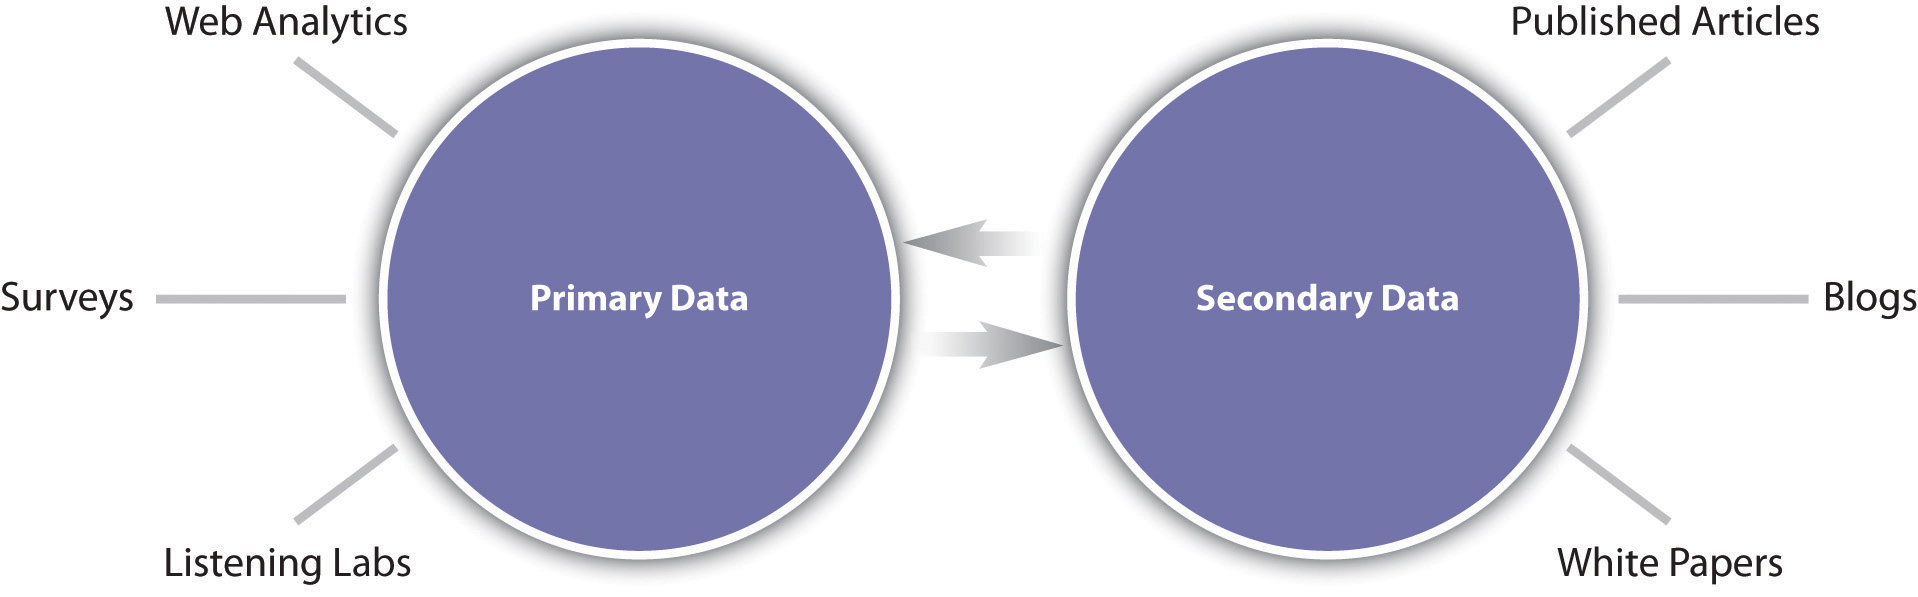
Providing primary and secondary data are very important in marketing research. This is especially true when presenting secondary research, because it is based on information from studies previously completed (i.e. from the primary data) by government agencies, chambers of commerce, trade associations, and other organizations. For example, U.S. Census Bureau information and Nielsen ratings are secondary market research. Secondary market research is easier to find, and much of it are free or low-cost. For instance, you can find secondary market research online at government or industry websites, at your local library, on business websites, and in magazines and newspapers. Although, the downside of using secondary market research is that it is not customized to your needs; so it may not be as useful as primary market research. For example, secondary research will tell you how much money U.S. teenagers spent last year on basketball shoes, but not how much they are willing to pay for a particular design of shoes your company has in mind. Overall, they are both important. Tabular representation of data is important when it comes to items countable, multi-dimensional, and in order of hierarchies. It provides a familiar way to deliver information that might otherwise not be understandable or readily understood. Any data before they are analyzed by statistical methods have to be organized and displayed, in a manner that is enlightening and attractive. Tabular representation is one form of doing it. But for those who do not have an affinity for numbers, tables are not more attractive. Graphic or diagrammatic presentation of data adds a pictorial influence to what would otherwise be just a number of figures. A major advantage of these representations is that they have more appeal –especially to a layman. They converse information visually. For this reason, graphs are often used in newspapers, magazines and businesses around the world. As types of data become discernible at a glance and in a graph, one can study easily the variation of data and hence know the connection between two or more sets of data. This will help in conjecturing. As a public health professional, consider the appropriateness of quantitative and qualitative data in community health assessments. Think about the benefits and limitations of quantitative and qualitative data in community health assessment.


