Quality improvement (QI) practices represent a leading approach to the essential, and often challenging, task of managing organizational change. Statistical process control (SPC) is, in turn, a key approach to QI. SPC was developed in the 1920s by the physicist Walter Shewhart to improve industrial manufacturing. It migrated to healthcare, first in laboratory settings (eg, Fisher and Humphries) and then into direct patient care applications, along with other approaches to QI. Before we report on our systematic review of the literature on how SPC has been applied to QI in healthcare, there is a need to define SPC and its role in QI.
SPC also provides analytical tools for understanding the variation revealed by measures of quality, and a method to taking action on the resulting information–with a view to making improvements. Polit & Chaboyer (2012) stated that SPC is simpler and more flexible than a traditional time-series analysis and does not require as many data points. Thus, SPC is a particularly valuable tool for intervention researchers who find that they are not in a position to randomize either individual participants (a standard RCT) or sites (cluster trials).
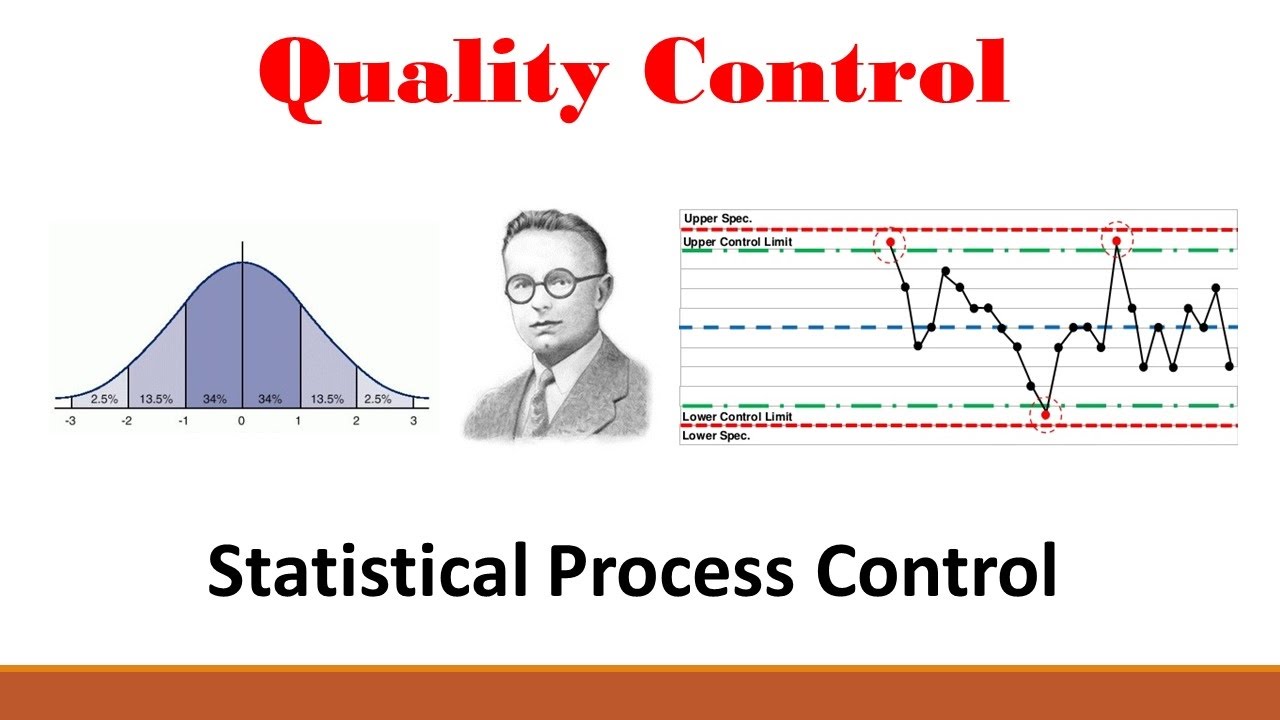
The control charts that form the backbone of SPC analysis provide a simple graphical approach for understanding variation. Following Shewhart’s initial work, SPC was later developed by Shewhart and Deming, and substantial literature now exists, including the application of SPC in healthcare. Poots and Woodcock (2012) supports that the most natural application of SPC in healthcare is to time series data – the natural ordering of the data in time is central to the correct application of the analysis. However, in the SPC literature there are conflicting opinions on the usage of control charts for data that does not come endowed with a natural ordering. Some authors recommend the use of control charts for such data, and some have used this analysis, for example in comparing hazard ratios for specific mortality rates. Other authors argue against the use of control charts in such situations.
In terms of how statistical process control methods are used in quality analysis, an application article presented, according to table 6 of the benefits of using statistical process control to improving clinical processes (Thor et al., 2006), include some of the following:-
- SPC is a useful tool for healthcare management, such as helping investigators and healthcare professionals identified areas of quality improvement–viewed as a valuable QI tool, which was easy to use, enable valuable prediction for future process performance, helped describe and quantify process variability, et cetera.
- SPC methods facilitated and documented healthcare process improvement such as helping investigators assess the impact of changes to the processes, leading methods to the contribution and improvement of healthcare processes, and allow us to identify critical areas of improvement for process performance.
- SPC methods helped process stakeholders by also enabling patients to be partners in clinical manage and health research, improve better and informed decision-making, empower process stakeholders and help stakeholders learn about their process management.
Thor, et al. (2006) point out, I quoted, “quality improvement (QI) practices represent a leading approach to the essential, and often challenging, task of managing organizational change. While statistical process control (SPC) is, in turn, a key approach to QI. SPC was developed in the 1920s as the history unveiled, by the physicist Walter Shewhart to improve industrial manufacturing. It migrated to healthcare, first in laboratory settings (eg, Fisher and Humphries3) and then into direct patient care applications, along with other approaches to QI.” As an added advantage and how statistical process control methods are used, like other approaches to collecting and analyzing data, statistical process control method is a rigorous, flexible approach to analyzing data for processes and outcomes, which can be tracked over time (Polit & Chaboyer, 2012). SPC can be used with data of various types. The data can be grouped in various ways, including temporal groupings (e.g., monthly) or sequential groups of a fixed size (e.g., 20 consecutive patients).The rules for interpreting a special cause, as statistically significant are easy to comprehend.